
Home
Opens at Apps → Bloom. Performance appears once your store has any pre-order or Notify Me activity.- Date range - 1d, 7d, 30d, 90d, 180d or 365d. Defaults to 30d.
- Audience - Human, Agents, Bots or All, beside the date range. Defaults to Human. Hover it for what each one counts.
- Last update - the rollup runs every 10 minutes, so charts can be up to 10 mins behind.
- Refresh stats - pulls the latest numbers on demand instead of waiting for the next rollup. Events from the last 60s may not be counted yet.
What counts
- Views - counted once the widget is on screen, not when the page loads.
- Human - ordinary shopper activity, including passive viewing and older history that wasn’t classified. Not proof of a human visitor.
- Agents - detected browser automation, not specifically AI.
- Bots - known bot user agents.
- All - every retained event, unfiltered.
- Not audience-filtered - Shopify sales and Klaviyo sends, opens and clicks. Orders and revenue may be zero or incomplete under Agents and Bots.
- Sold Out views - counted only when no other Bloom widget (pre-order, Notify Me or recommendations) shows for the variant.
Pre-order
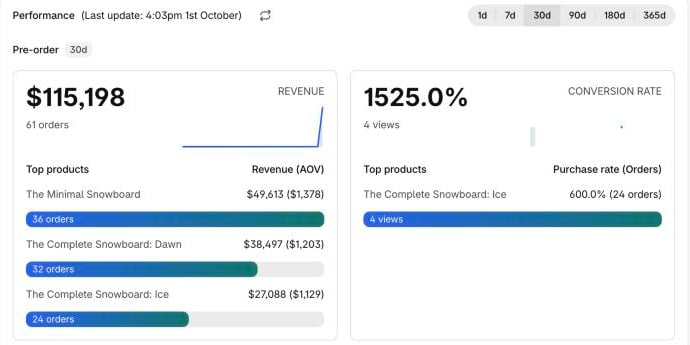
 Pre-order
- Revenue - total revenue from pre-order orders in the window, with the order count and a trend line.
- Conversion rate - orders ÷ views.
- Top products - Revenue (AOV) - top 6 variants by revenue, with AOV in brackets.
- Top products - Purchase rate (Orders) - top 6 variants by views, with purchase rate per variant.
Notify Me
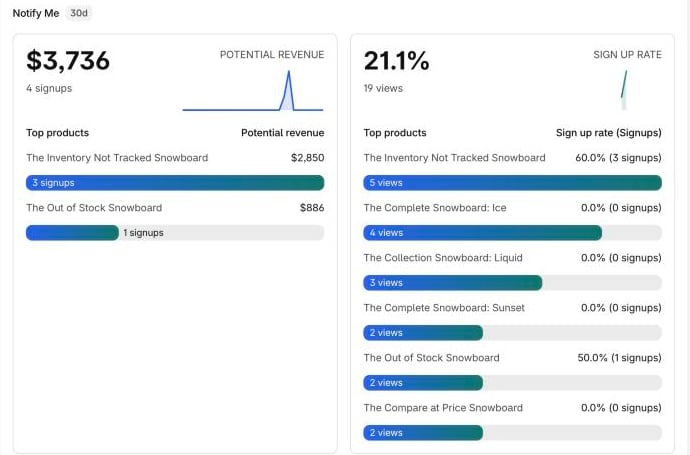
 Notify Me
- Potential revenue - sum of each sign-up’s variant price × 1 unit.
- Sign up rate - sign-ups ÷ views.
- Top products - Potential revenue - top 6 variants by potential revenue.
- Top products - Sign up rate (Signups) - top 6 variants by views, with sign-up rate per variant.
Feature Overview tab
Open Pre-order, Notify me or Recommendations in the Bloom sidebar. Overview is the first tab. The top card is a funnel for the window - View, Add to cart, Order and Revenue for pre-order, or View, Sign up, Sent, Opened, Clicked, Purchases and Revenue for Notify Me - with the same date-range and audience controls as Home. The top products table lists orders or sign-ups, revenue and views per variant. On Pre-order, status cards underneath count Active, Sold Out, Remaining, Sold (7d) and Disabled. See Back-in-stock results for the Notify Me funnel.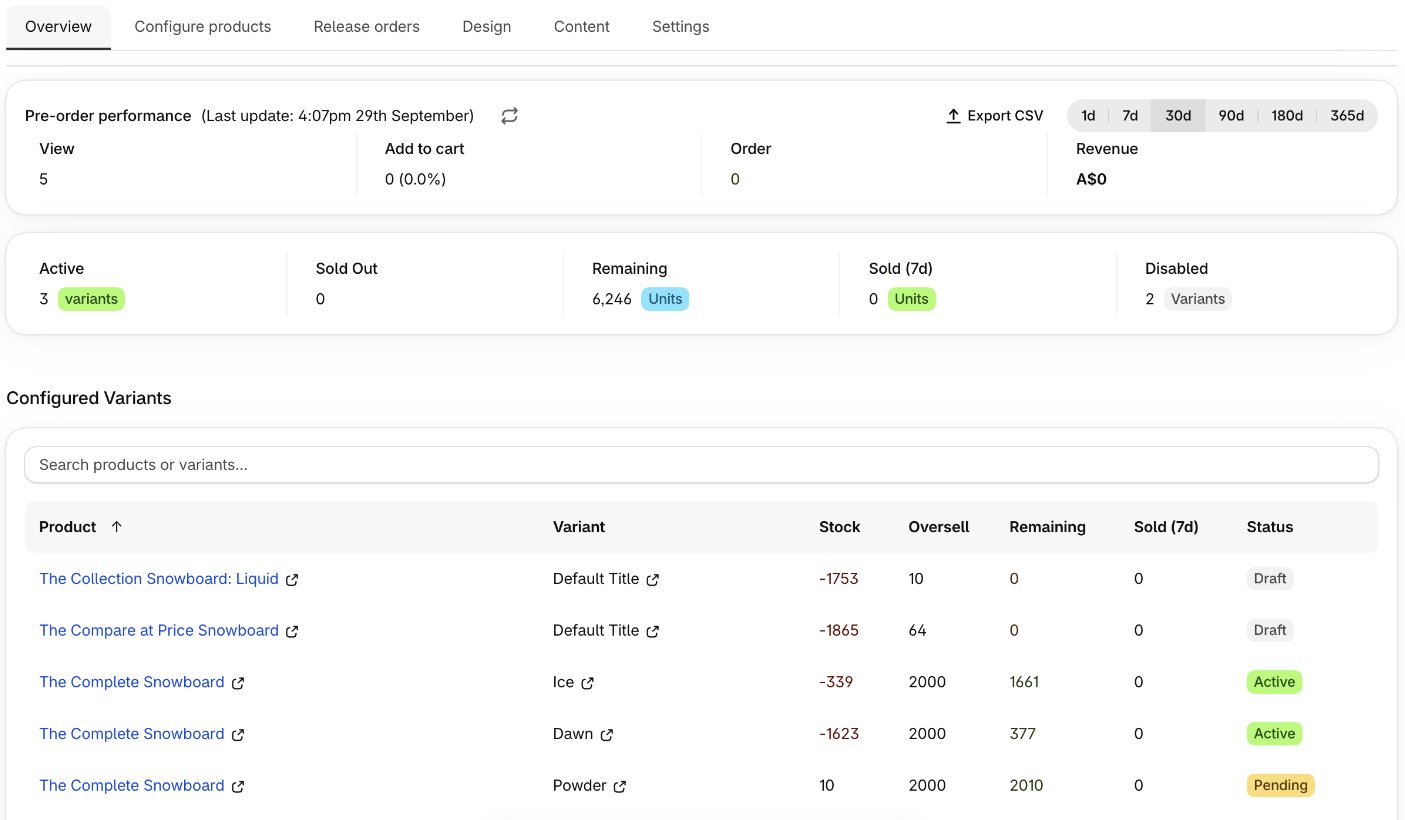
Configured Variants
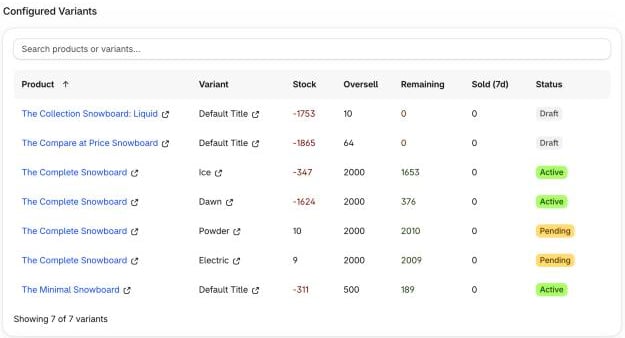
Every variant with pre-order configured. Sortable by any column, and searchable by product or variant name.- Product and Variant
- Stock - current Shopify inventory across every location. Negative means pre-orders have taken it below zero.
- Oversell - the oversell limit.
- Remaining - capacity left before the limit.
- Sold (7d) - units sold in the last 7 days.
- Status - Active, Scheduled, Pending, Sold out or Draft.
Design & content results
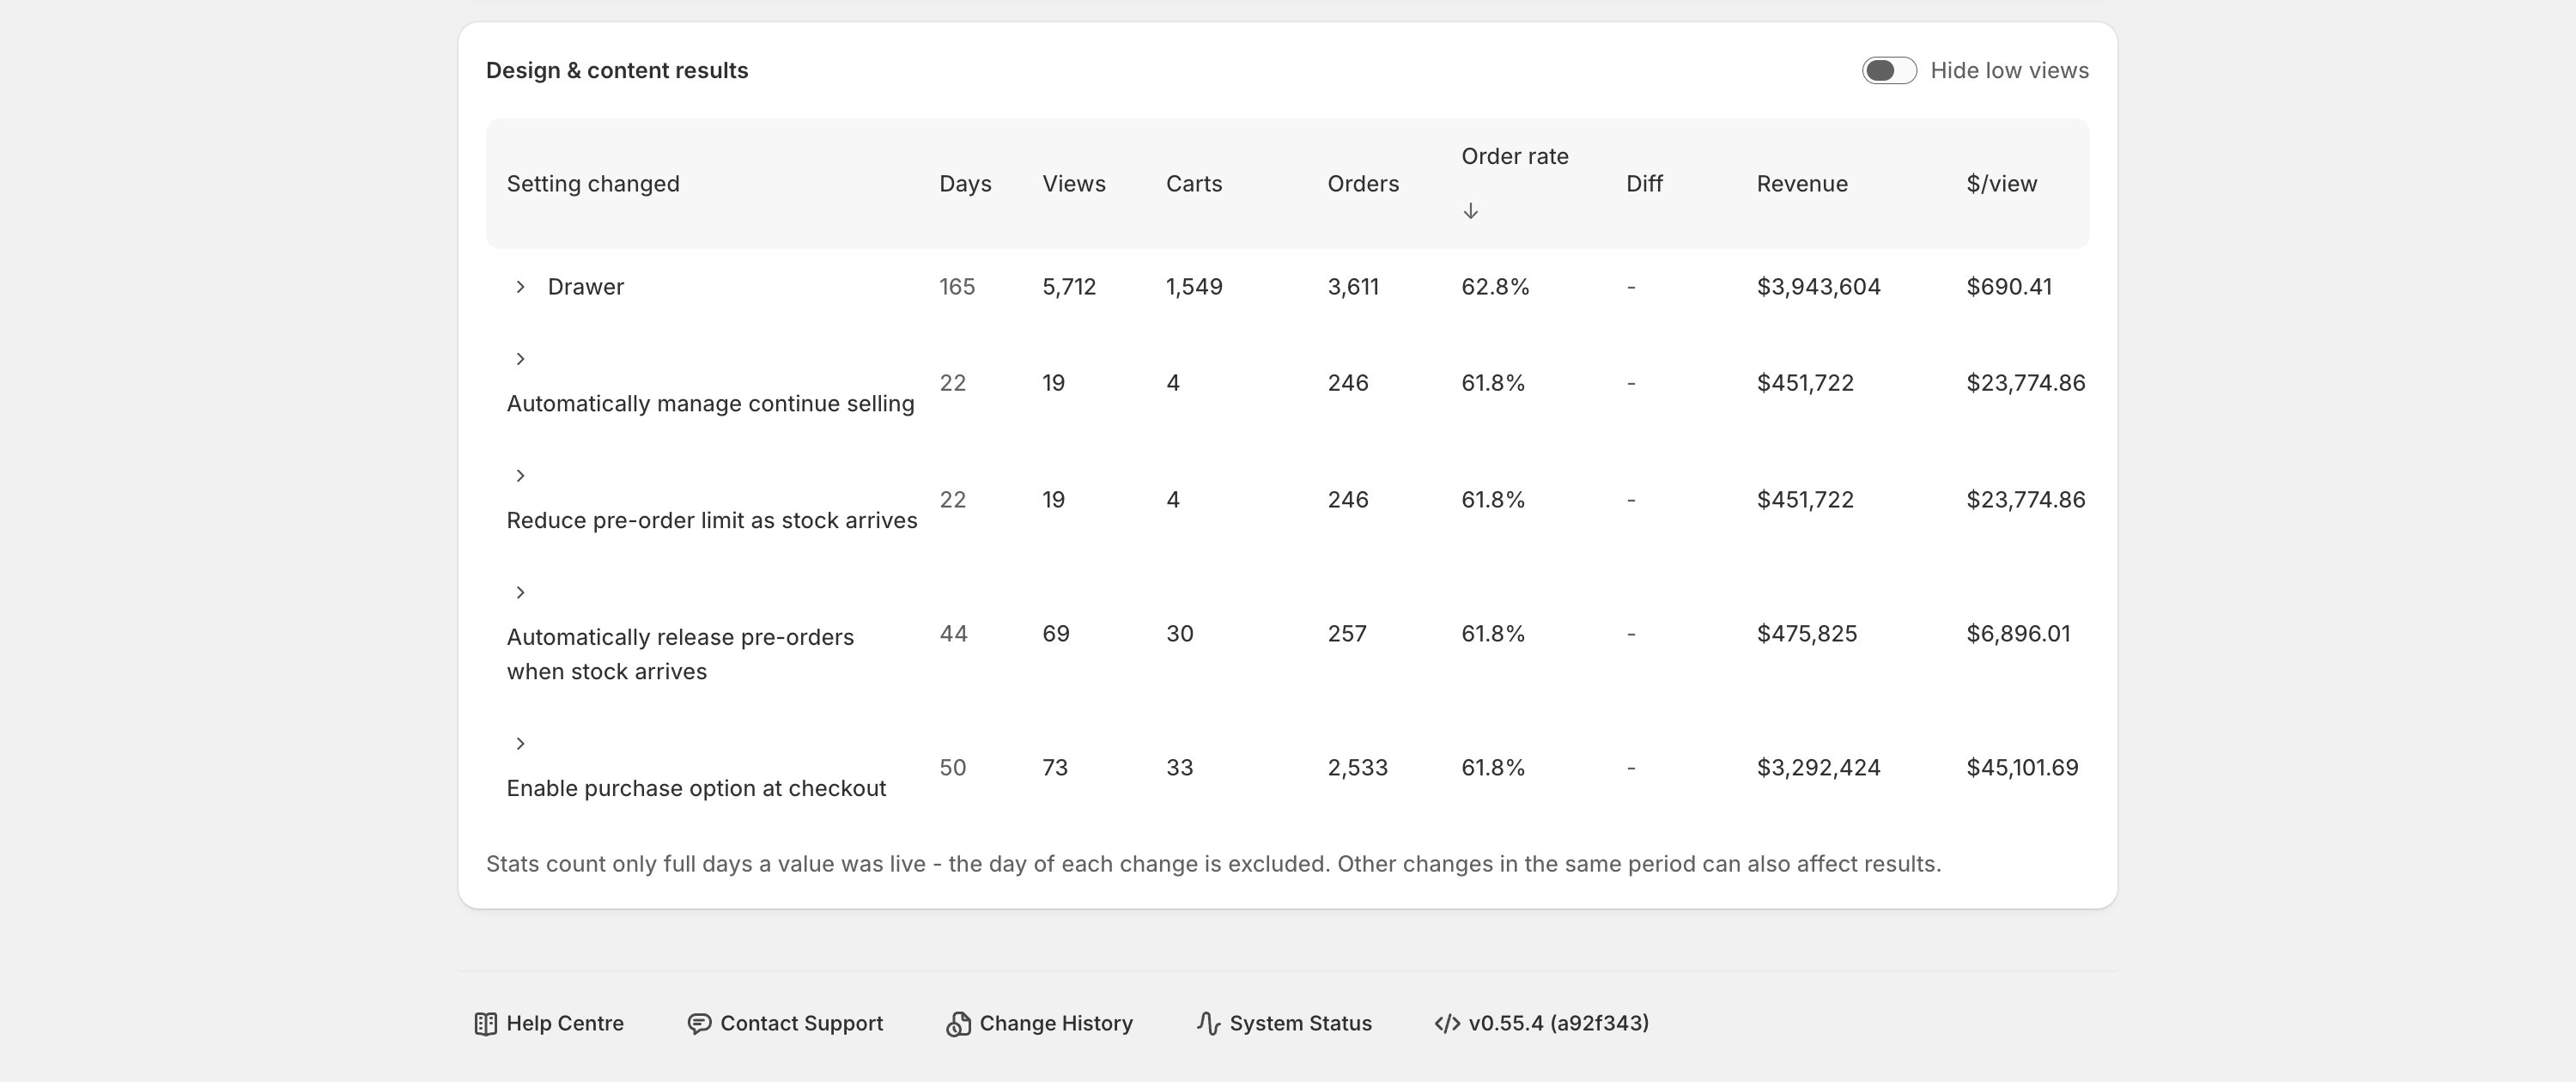
Shows how each design and content choice performed while it was live, so you can keep the values that convert. Built from your change history and daily analytics - no setup needed. Shows on the Pre-order and Notify me Overview tabs. For each setting, every value you’ve had live gets a row:- Views, carts, sign-ups (or orders for pre-order) while that value was live.
- Rate - sign-up or order rate. The group row shows the weighted average.
- Diff - relative change vs the previous value.
- Potential revenue (actual revenue for pre-order) and $/view.
- A value used more than once is bundled into one row - expand it to see when.
- Days you changed a value are excluded, so a row only counts full days.
- Hide low views (on by default) hides comparisons with under 1,000 views - too little traffic to compare fairly.
- Columns are sortable.
Export
Click Export CSV next to the date-range buttons on any feature’s Overview tab. The file covers the active feature, date window and audience: a total row, then every product with activity in that window. Klaviyo columns are marked as not audience-filtered. Each row carries product and variant IDs, the date range, timezone and currency, plus the feature’s funnel columns.