> ## Documentation Index
> Fetch the complete documentation index at: https://help.goodnative.co/llms.txt
> Use this file to discover all available pages before exploring further.
# Results
> See revenue, conversion, top products, and per-variant pre-order detail.
**The home page** is your dashboard; the **Results** page drills into per-variant detail.
## Home page
Opens at **Apps → Bloom**. Below the Getting Started checklist.
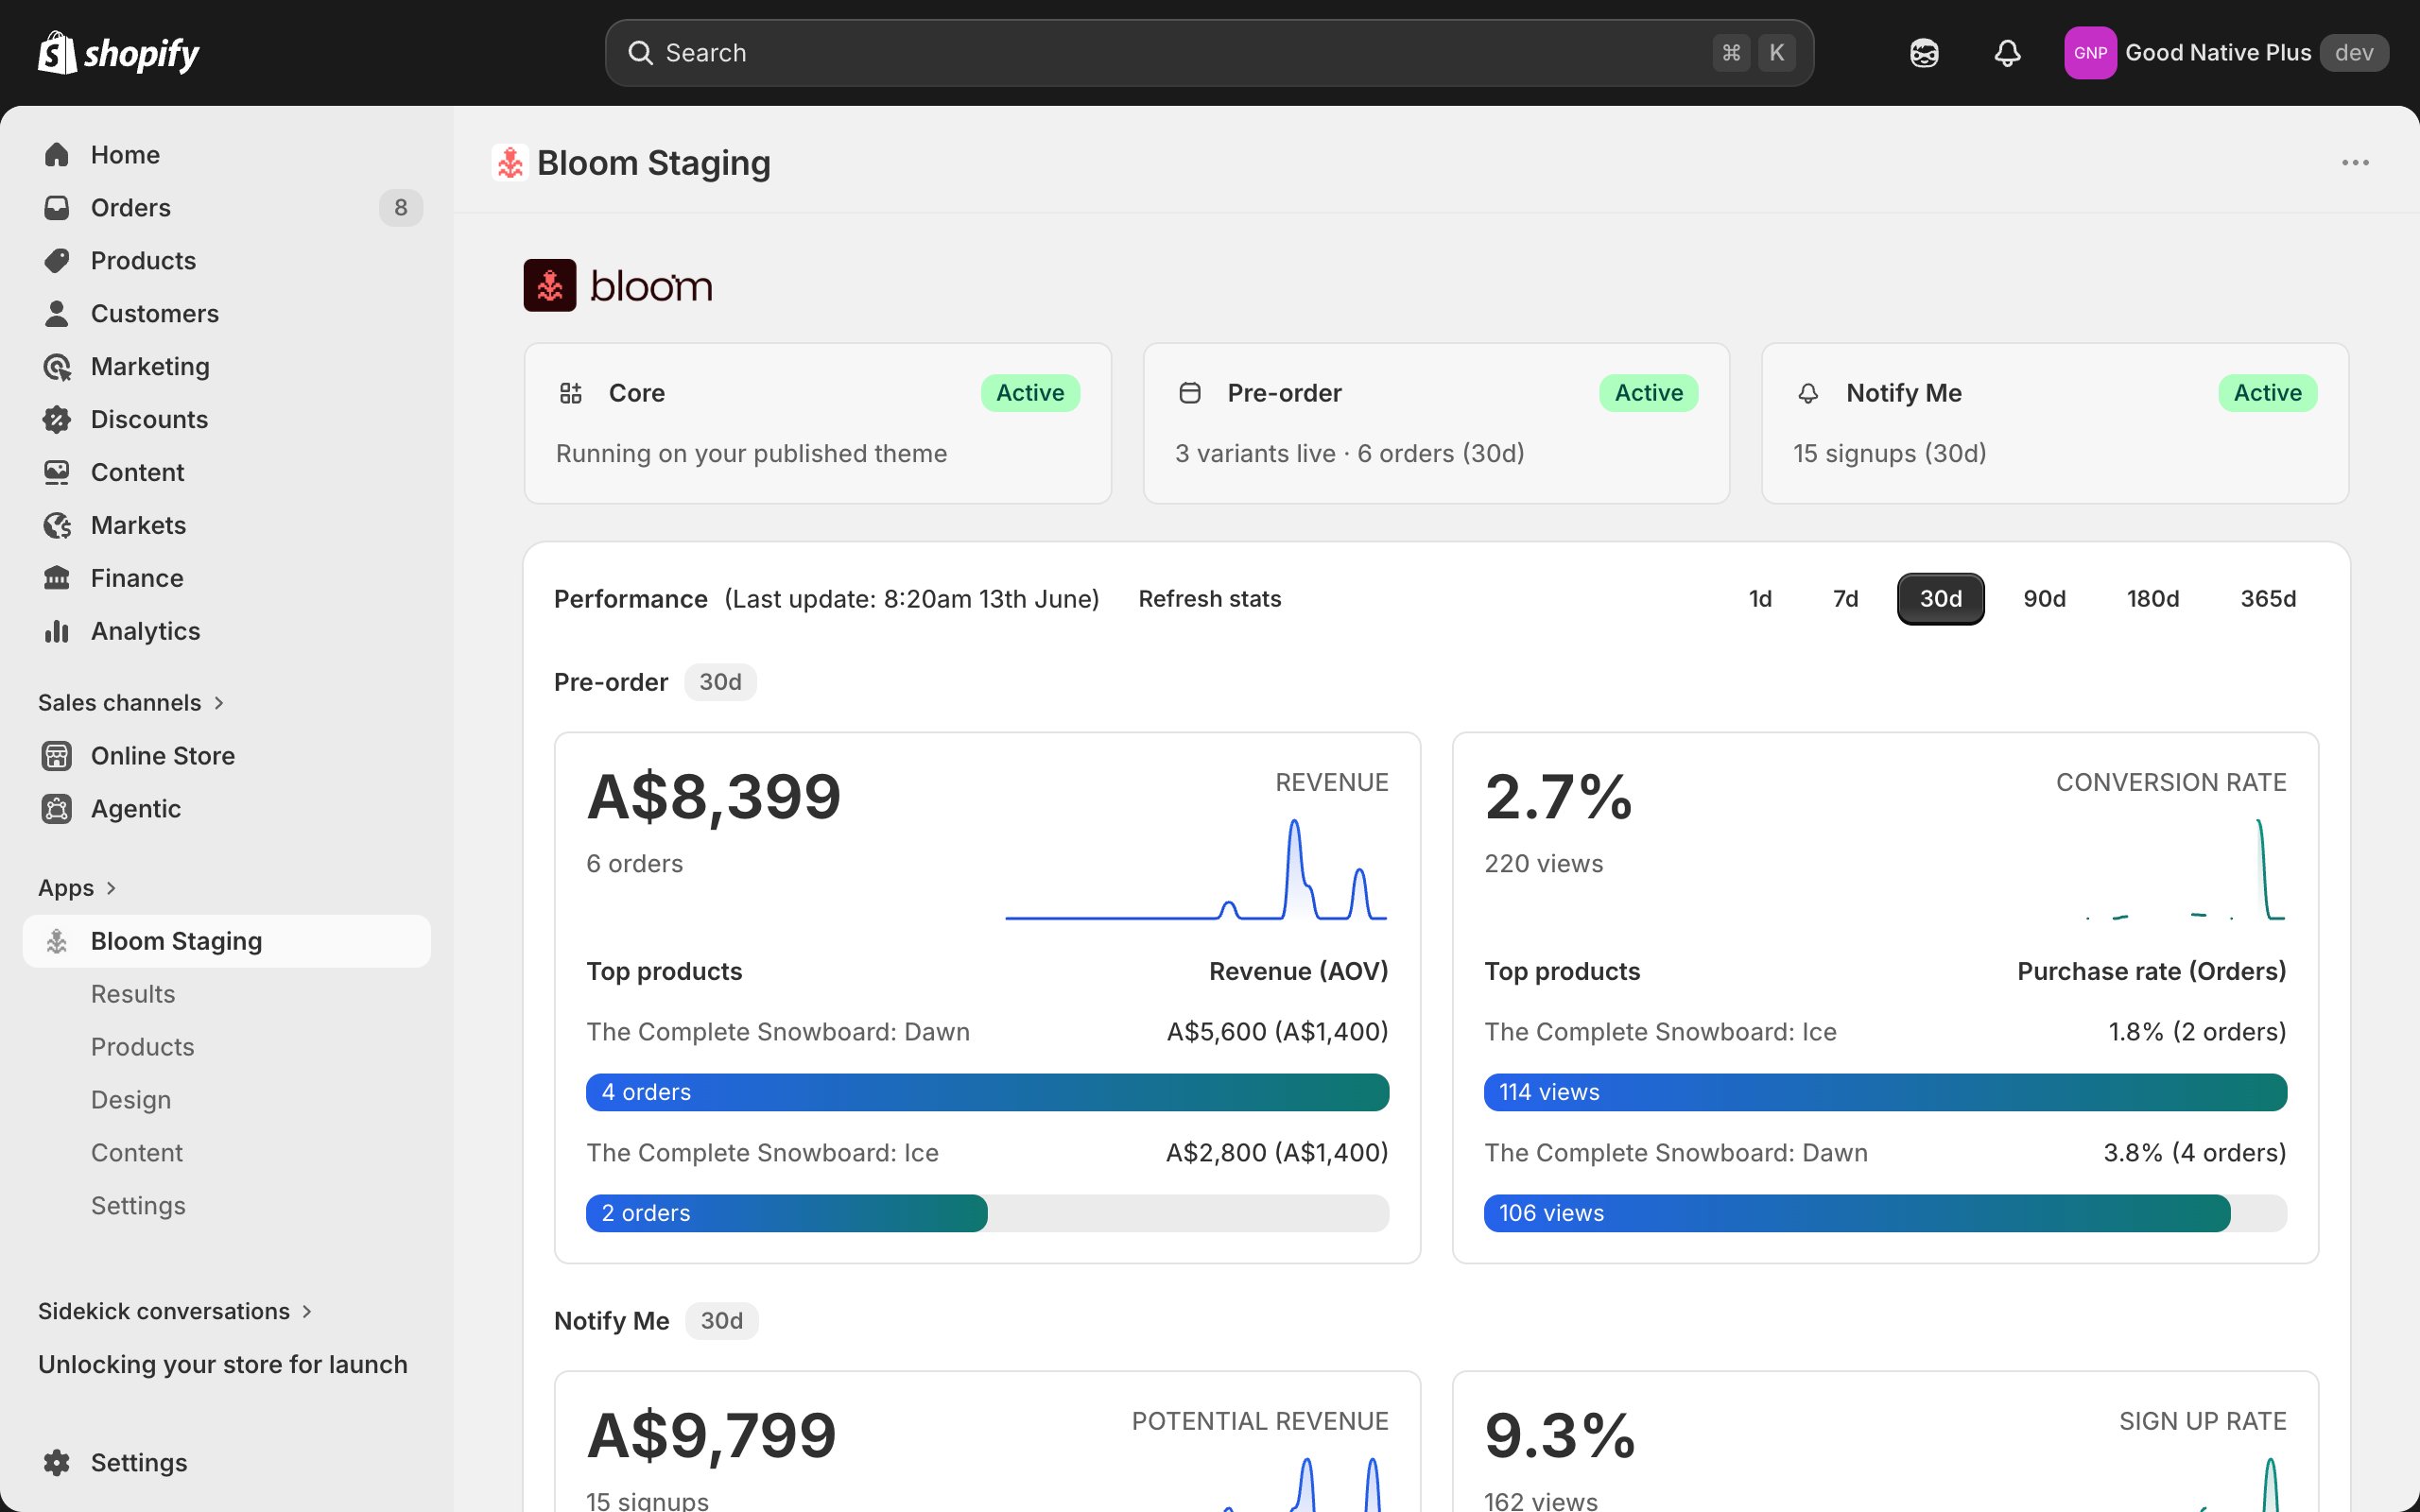 ### Performance
* **Date range** - **1d**, **7d**, **30d**, **90d**, **180d** or **365d**. Defaults to 30d.
* **Last update** - the rollup runs every 10 minutes, so charts can be up to 10 mins behind.
* **Refresh stats** - pulls the latest numbers on demand instead of waiting for the next rollup. Events from the last 60s may not be counted yet.
Pre-order
* **Revenue** - total revenue from pre-order orders in the window.
* **Conversion rate** - orders ÷ views.
* **Most revenue** - top 6 variants by revenue, with AOV in brackets.
* **Most viewed** - top 6 variants by views, with purchase rate per variant.
Notify Me
* **Potential revenue** - sum of each sign-up's variant price × 1 unit.
* **Sign up rate** - sign-ups ÷ views.
* **Most potential revenue** - top 6 variants by potential revenue.
* **Most viewed** - top 6 variants by views, with sign-up rate per variant.
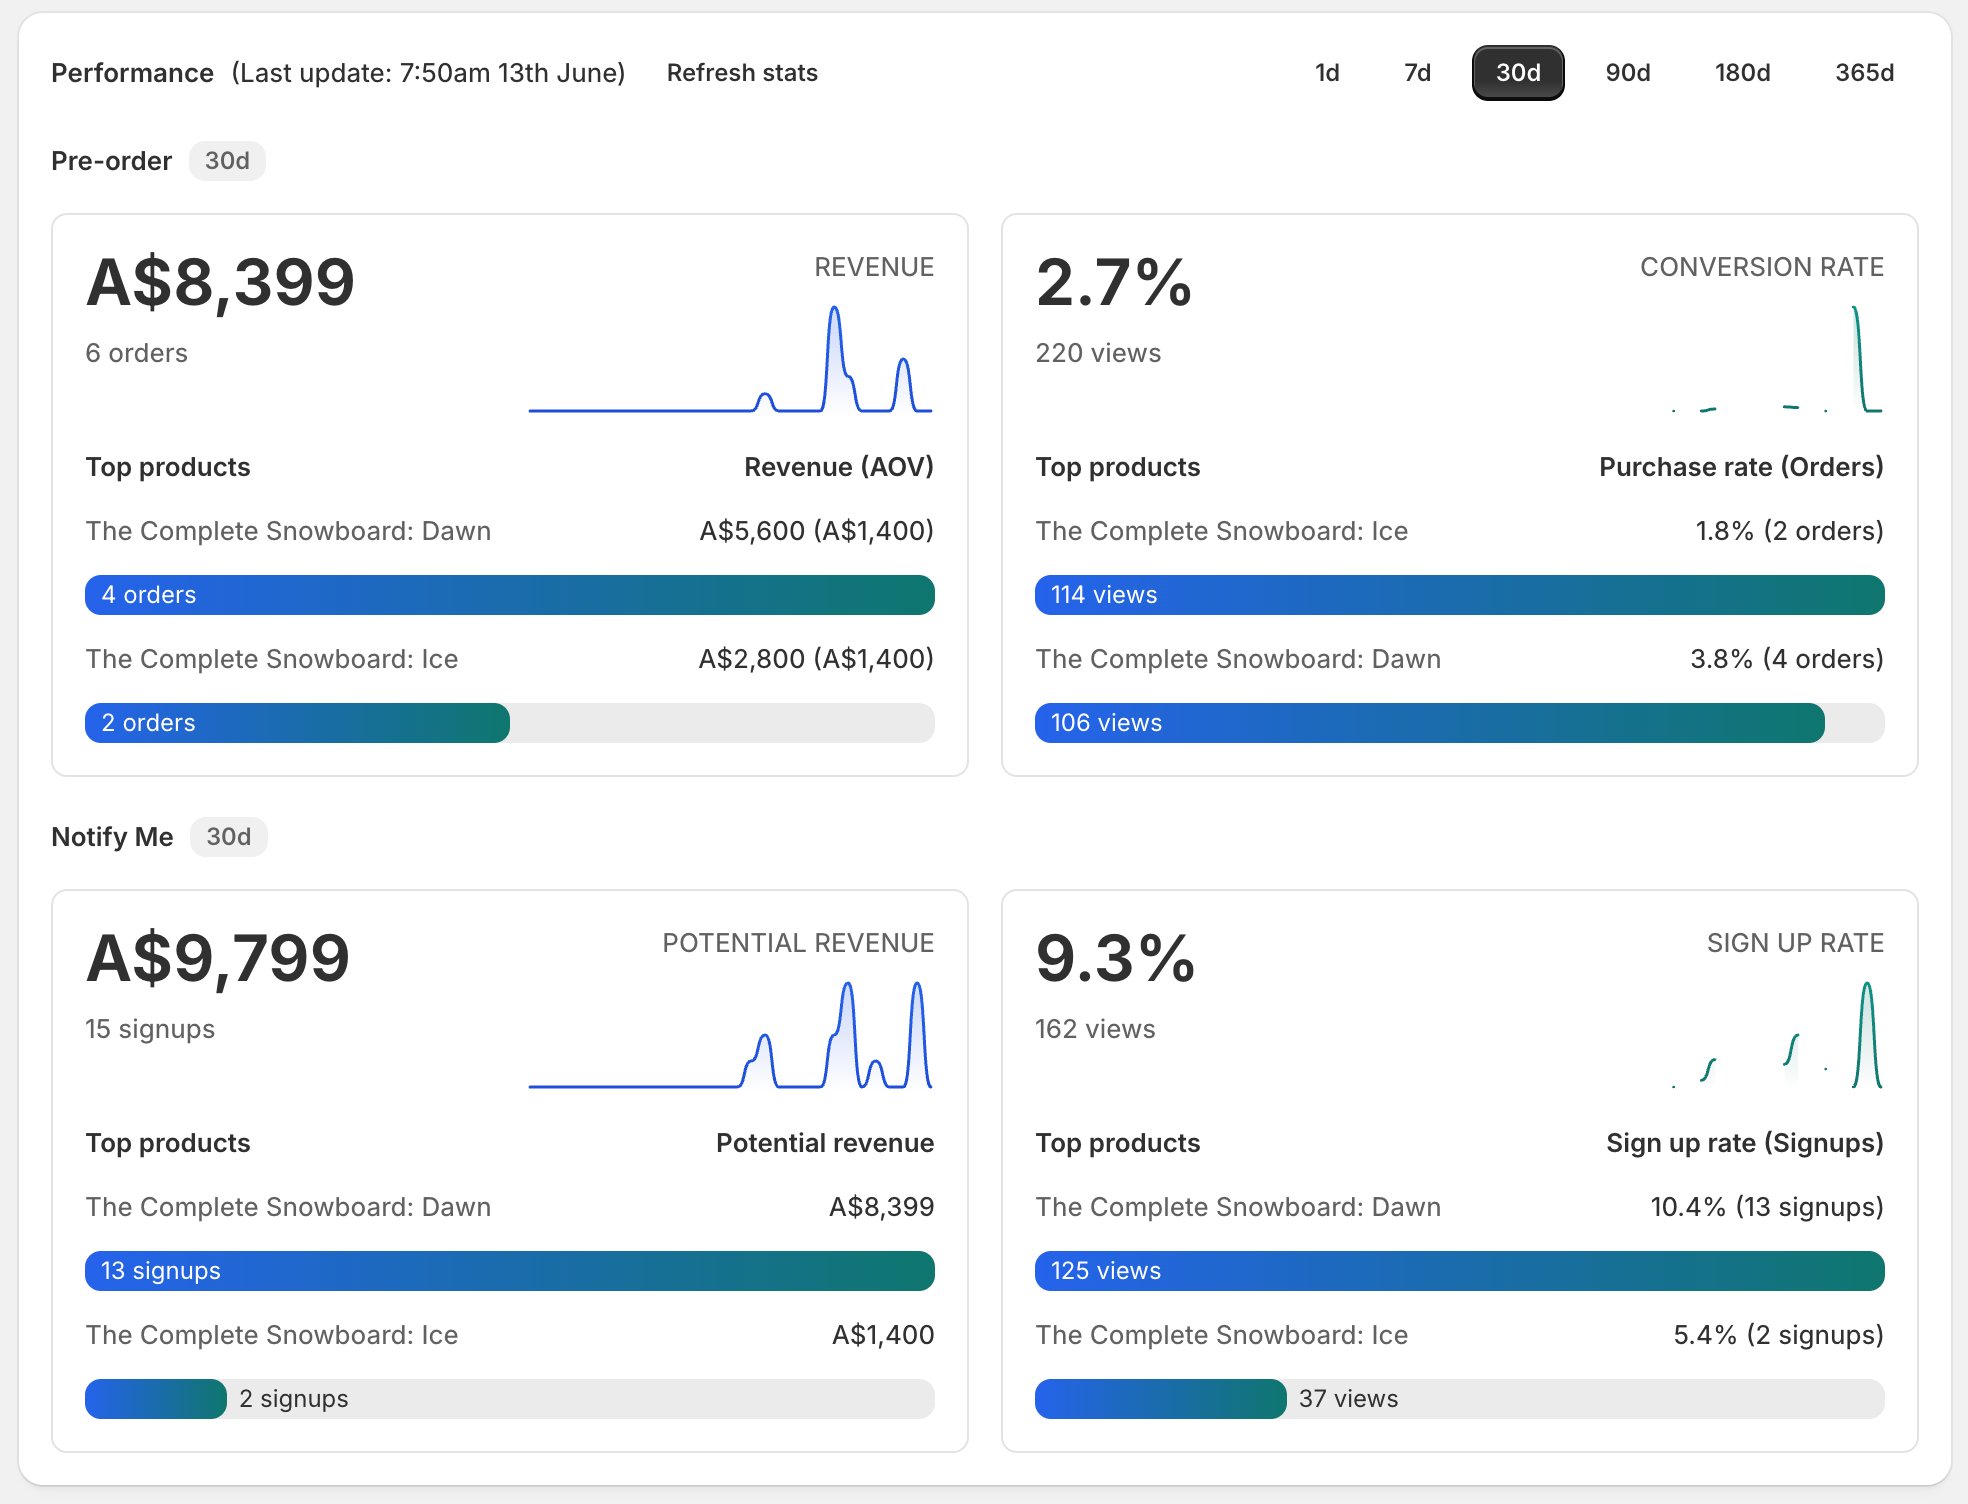
### Performance
* **Date range** - **1d**, **7d**, **30d**, **90d**, **180d** or **365d**. Defaults to 30d.
* **Last update** - the rollup runs every 10 minutes, so charts can be up to 10 mins behind.
* **Refresh stats** - pulls the latest numbers on demand instead of waiting for the next rollup. Events from the last 60s may not be counted yet.
Pre-order
* **Revenue** - total revenue from pre-order orders in the window.
* **Conversion rate** - orders ÷ views.
* **Most revenue** - top 6 variants by revenue, with AOV in brackets.
* **Most viewed** - top 6 variants by views, with purchase rate per variant.
Notify Me
* **Potential revenue** - sum of each sign-up's variant price × 1 unit.
* **Sign up rate** - sign-ups ÷ views.
* **Most potential revenue** - top 6 variants by potential revenue.
* **Most viewed** - top 6 variants by views, with sign-up rate per variant.
 ## Results page
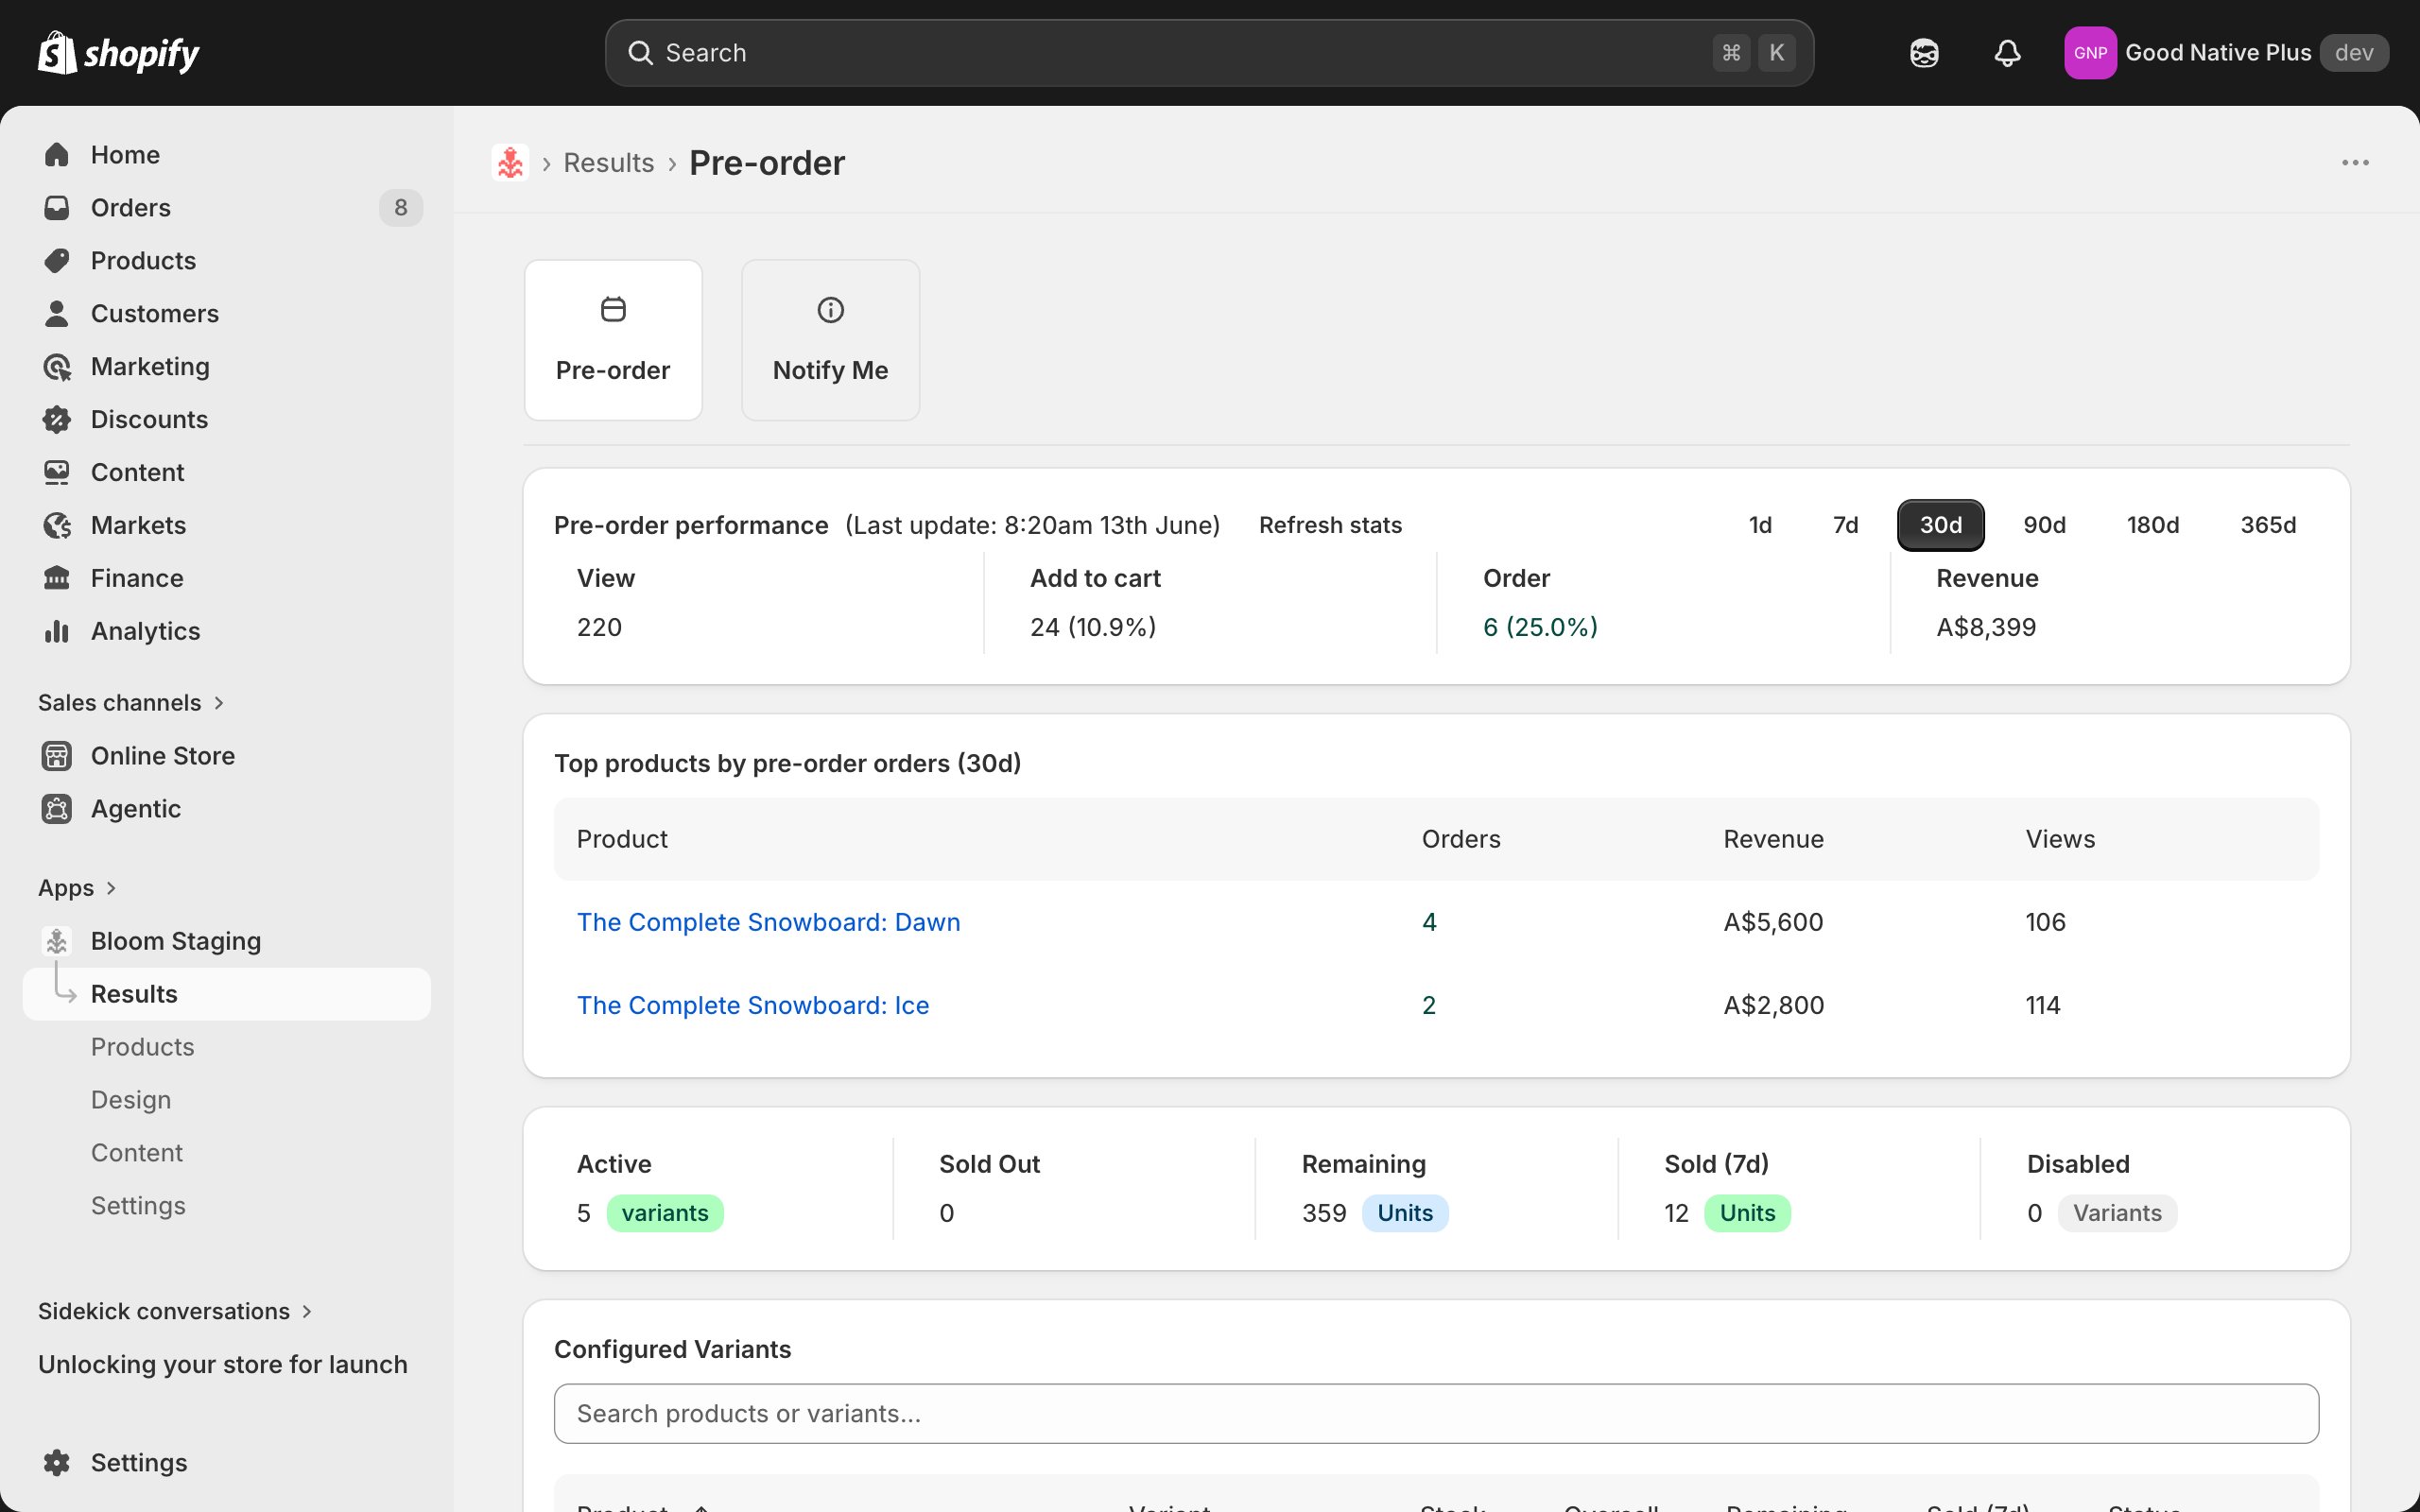
Under **Apps → Bloom → Results**. Tab between **Pre-order** and **Notify Me** at the top.
Same Performance charts as the home page, plus a per-variant table.
## Results page
Under **Apps → Bloom → Results**. Tab between **Pre-order** and **Notify Me** at the top.
Same Performance charts as the home page, plus a per-variant table.
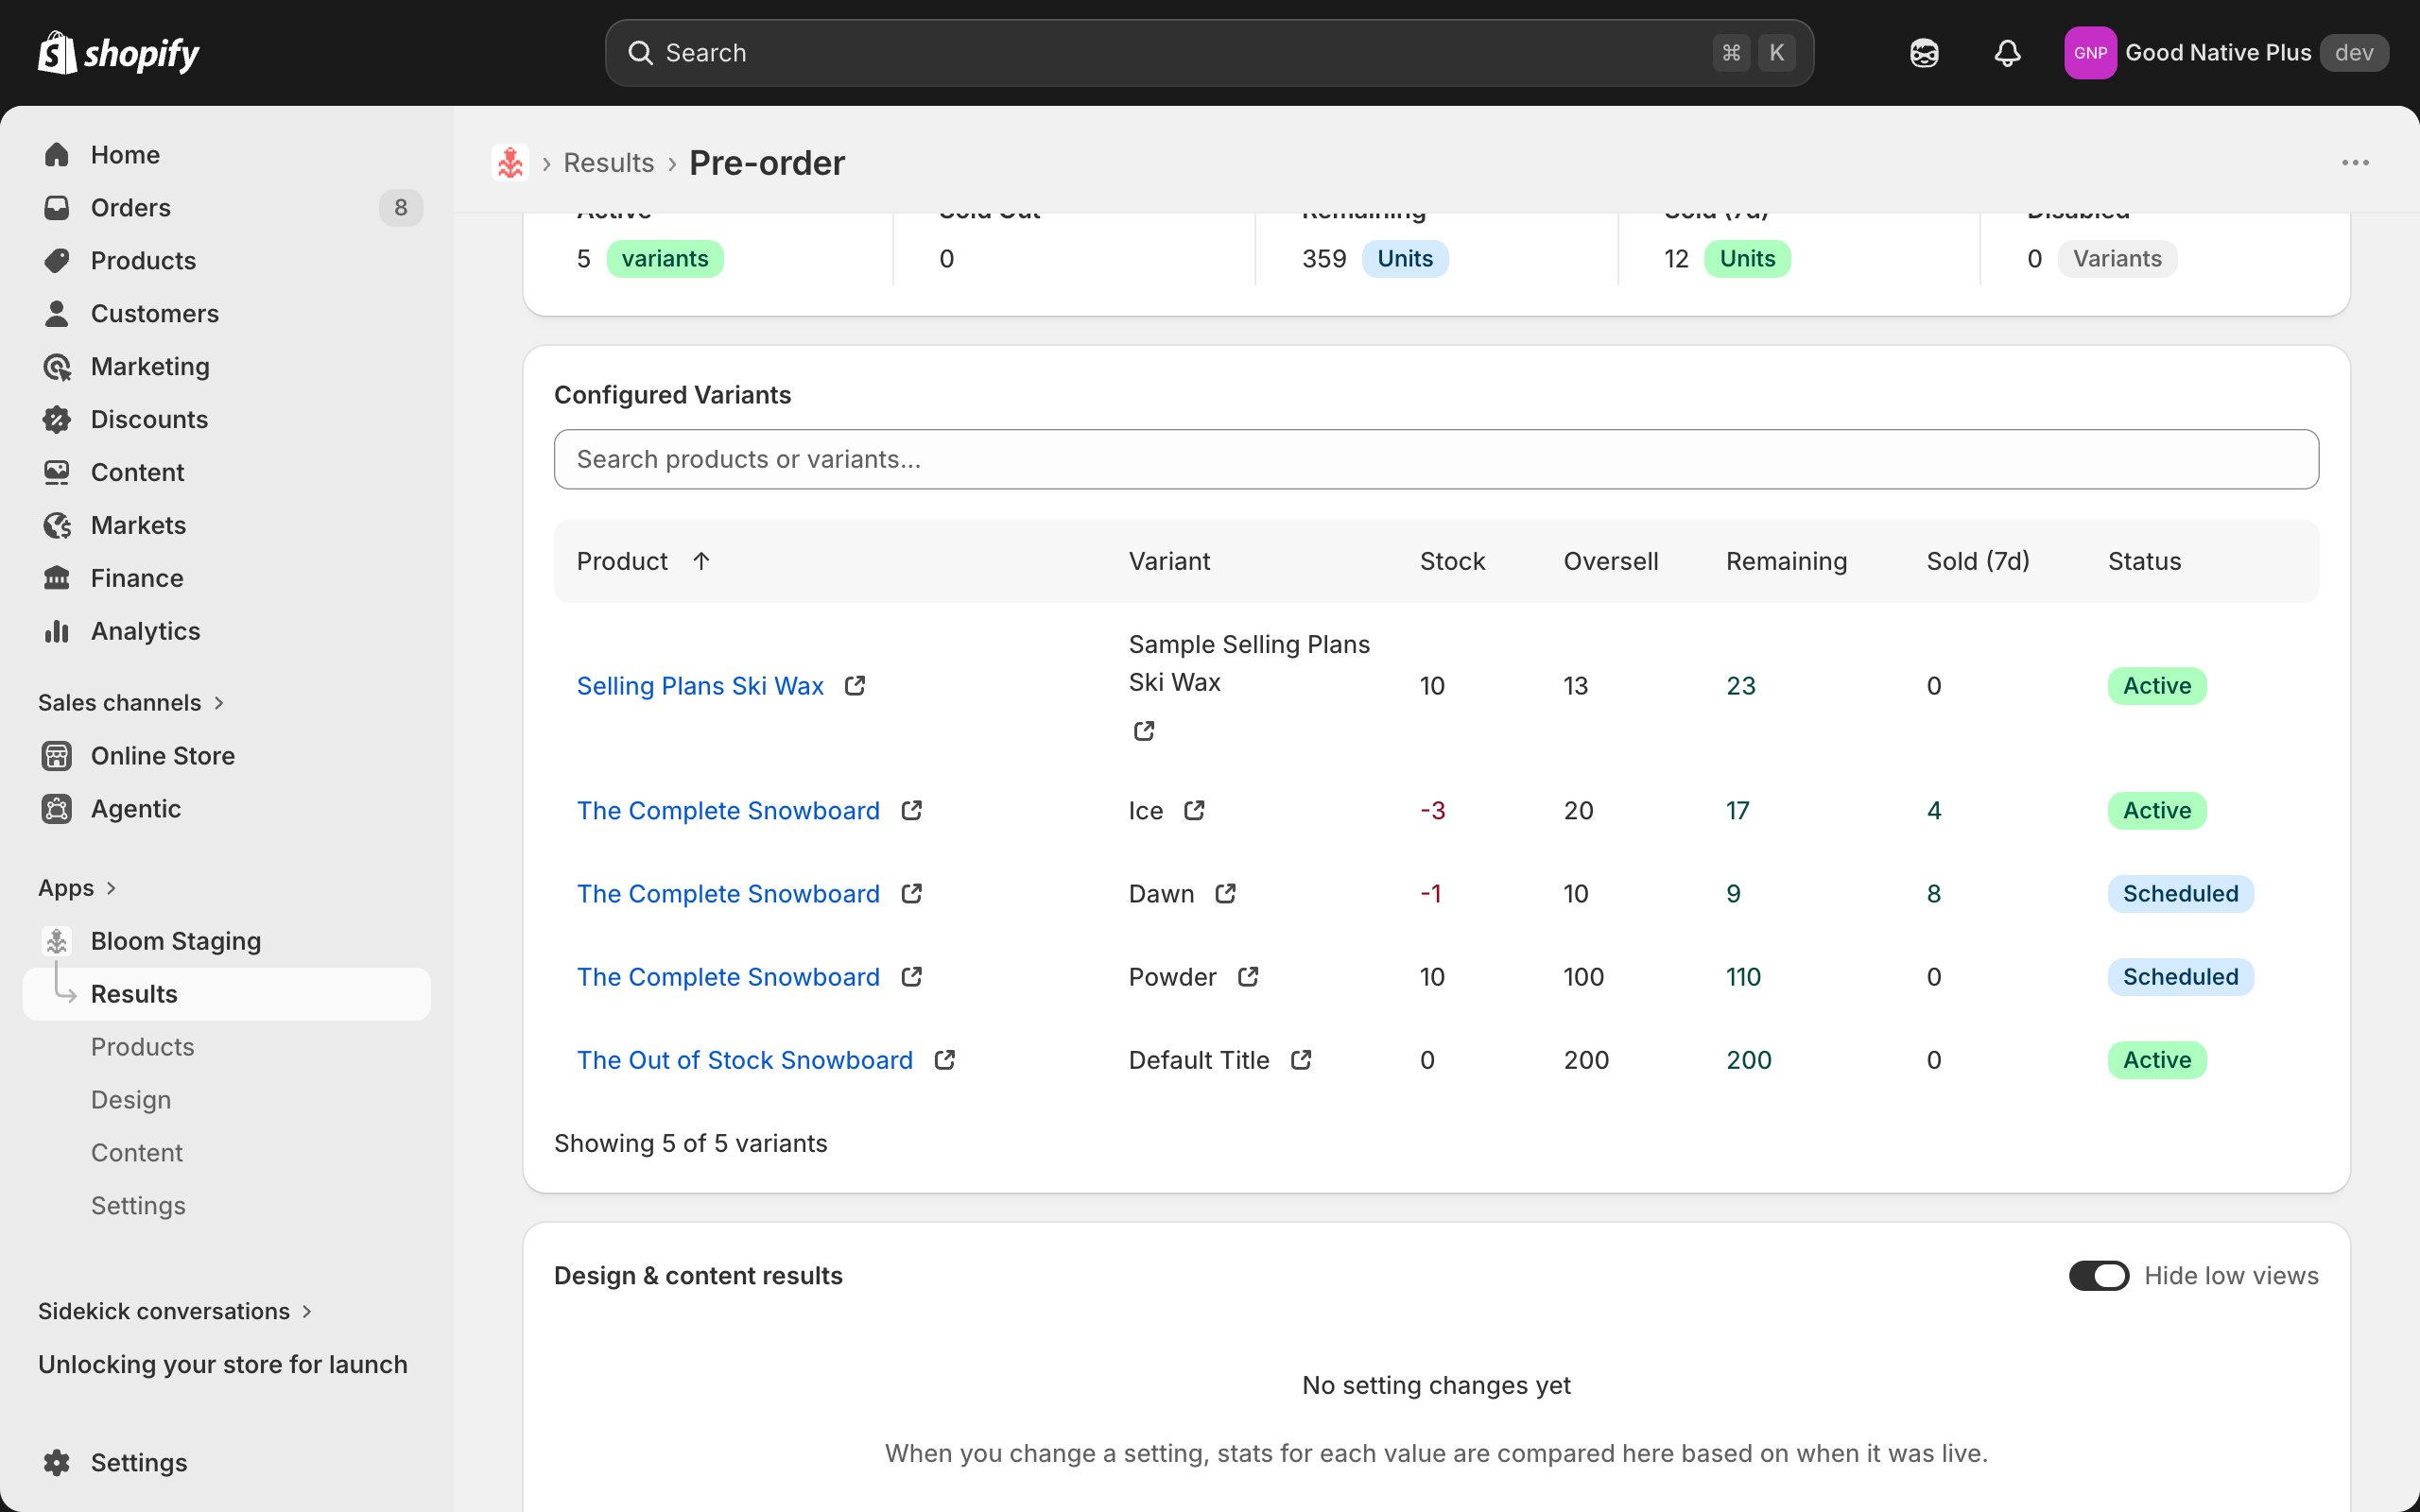
 ### Configured variants
Every variant with pre-order or Notify Me configured. Sortable by any column.
* **Product** and **Variant**
* **Stock** - current Shopify inventory.
* **Oversell** - the oversell limit.
* **Remaining** - capacity left before the limit.
* **Sold (7d)** - units sold in the last 7 days.
* **Status** - Active, Scheduled, Sold Out or Disabled.
Use it to spot variants approaching their oversell limit.
### Configured variants
Every variant with pre-order or Notify Me configured. Sortable by any column.
* **Product** and **Variant**
* **Stock** - current Shopify inventory.
* **Oversell** - the oversell limit.
* **Remaining** - capacity left before the limit.
* **Sold (7d)** - units sold in the last 7 days.
* **Status** - Active, Scheduled, Sold Out or Disabled.
Use it to spot variants approaching their oversell limit.
 ### Design & content results
Shows how each design and content choice performed while it was live, so you can keep the values that convert. Built from your [change history](/bloom/change-history) and daily analytics - no setup needed. Works on both the **Pre-order** and **Notify Me** tabs.
For each setting, every value you've had live gets a row:
* **Views, starts, sign-ups** (or orders for pre-order) while that value was live.
* **Rate** - sign-up or purchase rate. The group row shows the weighted average.
* **Diff** - relative change vs the previous value.
* **Potential revenue** (actual revenue for pre-order) and **\$/view**.
Notes on how rows are counted:
* A value used more than once is bundled into one row - hover the date ranges to see when.
* Days you changed a value are excluded, so a row only counts full days.
* **Hide low views** (on by default) hides comparisons with under 1,000 views - too little traffic to compare fairly.
* Columns are sortable.
## Empty state
Newly installed stores stay empty until activity rolls up - within 10 minutes of the first event.
## Related
{/* #fix-screenshot "Design & content results section" */}
{/* TODO: screenshot — Performance section, both panels */}
{/* TODO: screenshot — Results page, Pre-order tab */}
* [Pre-order overview](/bloom/pre-order/overview)
* [Notify Me overview](/bloom/notify-me/overview)
* [Plans and billing](/bloom/plans-and-billing)
* [Change history](/bloom/change-history)
### Design & content results
Shows how each design and content choice performed while it was live, so you can keep the values that convert. Built from your [change history](/bloom/change-history) and daily analytics - no setup needed. Works on both the **Pre-order** and **Notify Me** tabs.
For each setting, every value you've had live gets a row:
* **Views, starts, sign-ups** (or orders for pre-order) while that value was live.
* **Rate** - sign-up or purchase rate. The group row shows the weighted average.
* **Diff** - relative change vs the previous value.
* **Potential revenue** (actual revenue for pre-order) and **\$/view**.
Notes on how rows are counted:
* A value used more than once is bundled into one row - hover the date ranges to see when.
* Days you changed a value are excluded, so a row only counts full days.
* **Hide low views** (on by default) hides comparisons with under 1,000 views - too little traffic to compare fairly.
* Columns are sortable.
## Empty state
Newly installed stores stay empty until activity rolls up - within 10 minutes of the first event.
## Related
{/* #fix-screenshot "Design & content results section" */}
{/* TODO: screenshot — Performance section, both panels */}
{/* TODO: screenshot — Results page, Pre-order tab */}
* [Pre-order overview](/bloom/pre-order/overview)
* [Notify Me overview](/bloom/notify-me/overview)
* [Plans and billing](/bloom/plans-and-billing)
* [Change history](/bloom/change-history)